- December 4, 2023
- by Educational Initiatives
- Blog
- 0 Comments
ASSET is a skill-based test that measures students’ conceptual understanding and benchmarks the performance of schools nationally with actionable insights and reports. Students get feedback on their areas of weakness, and teachers on concepts their students are not understanding. ASSET is offered in English, Mathematics and Science (for classes 3-10), Social Studies (for classes 5-9) and Hindi (for classes 4-8). The duration of each ASSET test is between 45 and 70 minutes.
ASSET is offered in online and pen-and-paper modes, predominantly in India and the UAE. While the test is taken entirely online in the UAE, most schools in India opt for the pen-and-paper version of the test.[1] The pen-and-paper version of ASSET is an entirely multiple-choice test.
How can we know if a particular ASSET test paper is too long? (In the online version of the test, it is easy to determine the time taken by students for any question or if students faced time difficulty in completing the test. But how can this be determined for the pen-and-paper test?[2])
We should note, at this point, that ASSET is a low-stakes test. This means that its purpose is to provide feedback, and there are no significant consequences – either to a student’s performance in school or any other reward or punishment – to a student’s performance in ASSET. Further, since all the students of the same class receive the same paper in a subject, small variations in paper difficulty or paper length do not matter much as every student faces the same advantage or disadvantage. Yet, it is always useful to analyse aspects like paper length, as this can help improve future papers and also help understand student thinking better.
Skip or missed questions: Every question has four options – A, B, C and D of which only one is correct. If a student marks more than one option, that is invalid (and the student is marked wrong). If a student does not select any option for a question, that is a ‘missed question’ or a ‘skip’, as we should refer to it in this article.
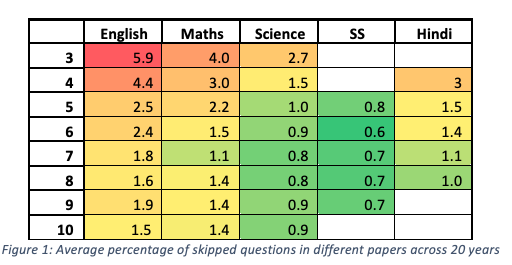
How much do students skip questions? In the 21 years that ASSET has been conducted, students have skipped questions 1.73% of the time! But the pattern in these skips is both interesting and revealing. For example, the table below shows that while questions are skipped 5.9% in class 3 English paper, they are skipped only 0.6% of the time in class 6 Social Studies paper.
Why do students skip questions? We can try and hypothesise why students skip questions. Clearly, if students do not reach a question – either because they somehow ‘miss’ it or run out of time before reaching a question, they will skip it. They may skip a question that they find difficult, confusing or tedious. Note that these 3 terms have specific meanings – ‘difficult’ means that the percentage of students answering correctly is low; ‘confusing’ means that the students are not able to select between the options (due to which the percentage of students choosing the different options is similar) and ‘tedious’ could refer to questions that are either too long or have procedures that may be lengthy or mechanical. In this article, we shall see if the first two relate to skipping.
Interesting patterns were observed related to students skipping questions:
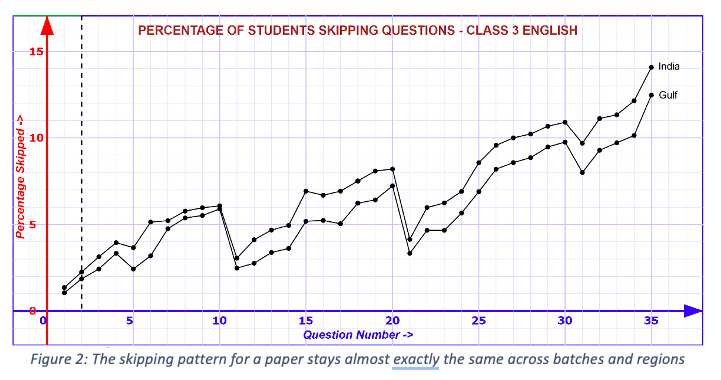
1. Question Skipping is a Paper Characteristic: Data shows that if a paper is given to students in different batches or to students in different regions, the pattern of skipping, surprisingly, is very similar. As an example, see the graphs below, which show the same ASSET paper given to students in India and the Middle East. Though the percentage of students actually skipping questions is different, the shape of the graph is almost identical. This ‘skipping graph’ is almost like a fingerprint uniquely identifying a paper.
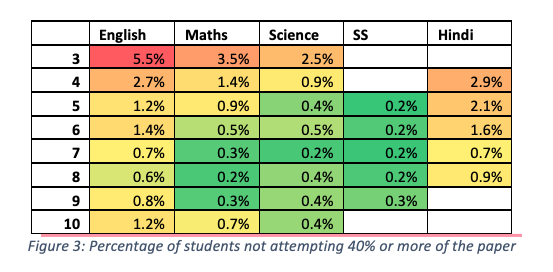
2. Younger children tend to skip questions more: We already got an indication of this from Figure 1. However, it is interesting to check the percentage of students who skip a large number of questions. The table below shows the percentage of children who do not answer 40% of the paper or more, and the trends are very similar to what we see in Figure 1.
3. Skipping is linked to the subject: The language papers like English and Hindi have the highest extent of skipping, and Social Studies has the least. Mathematics and Science fall in between. We cannot conclusively explain the reason for this trend, though the trend itself is very clear. A multiple regression run of the different factors found that after the class level, subject was most predictive of the extent of skipping.
4. Difficult questions or even confusing questions, are not skipped much more: It seems likely that if a question is difficult or confusing, students would skip such a question more. But surprisingly, this turns out not to be true.

5. The strongest predictor of skipping is the position of a question in a test: The final finding is also a surprise. The best predictor of the extent of skip seems to be not a characteristic of the question at all, but merely its position in the question paper! Across all papers, skip percentages increase almost continuously from question 1 till the last question. In some papers, the rate of increase is low (Figure 5) while it is higher in others (Figure 1). In the figure below, the green line represents the average slope of the increase.

Determining paper lengthiness from question skip data:
The previous analysis shows that every paper seems to have a ‘natural slope’ and a ‘natural question skipping rate’. Even across over 20 or 30 papers, which typically represent students over 10-15 years, the skipping pattern of English Class 3 papers remains very steady and never resembles the skipping pattern of, say, a Science Class 7 paper.
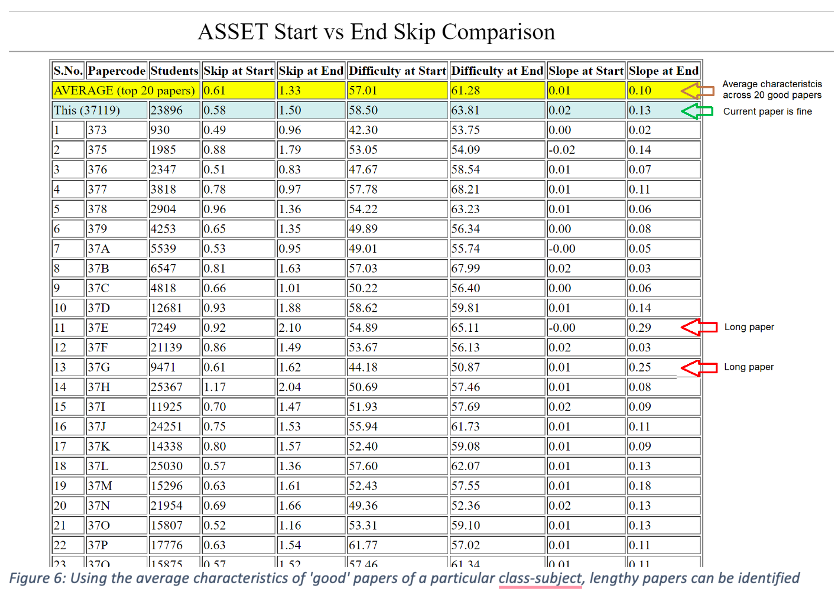
Furthermore, the skipping rate seems to increase fairly steadily, and in case a paper is too long, we can expect an unusual increase towards the end of the paper. (We define the start of the paper as the first 75% of the questions and the ‘end’ as the remaining.)
In order to compare this quantitatively, we calculate the average of the 20 best papers, defined as those papers that had the lowest percentage of skips towards the end of the paper. The table shows below compares the average characteristics of the top 20 papers with the current paper. However, since all past papers are shown, long papers can easily be identified, as shown below.
Summary and Conclusion
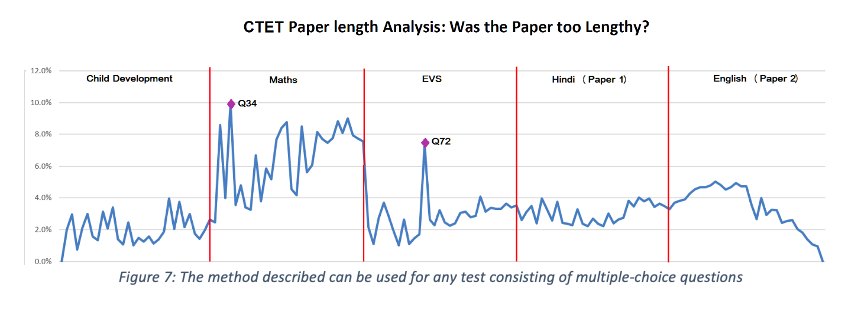
The procedure described above can be used for any multiple-choice paper-and-pen test to provide an indication if the paper is too long. We used this technique with one of the past Central Teacher Eligibility Test (CTET) papers. The analysis suggested that even though the paper had other issues, the paper was not too long for the time provided.
___________
[1] Though schools took the test online during Covid (students usually take the test from home), return to school was also marked by a return-to-paper for ASSET!
[2] The rest of this article focuses only on the paper-and-pen version of the ASSET test.

