- December 4, 2023
- by Educational Initiatives
- Blog
- 0 Comments
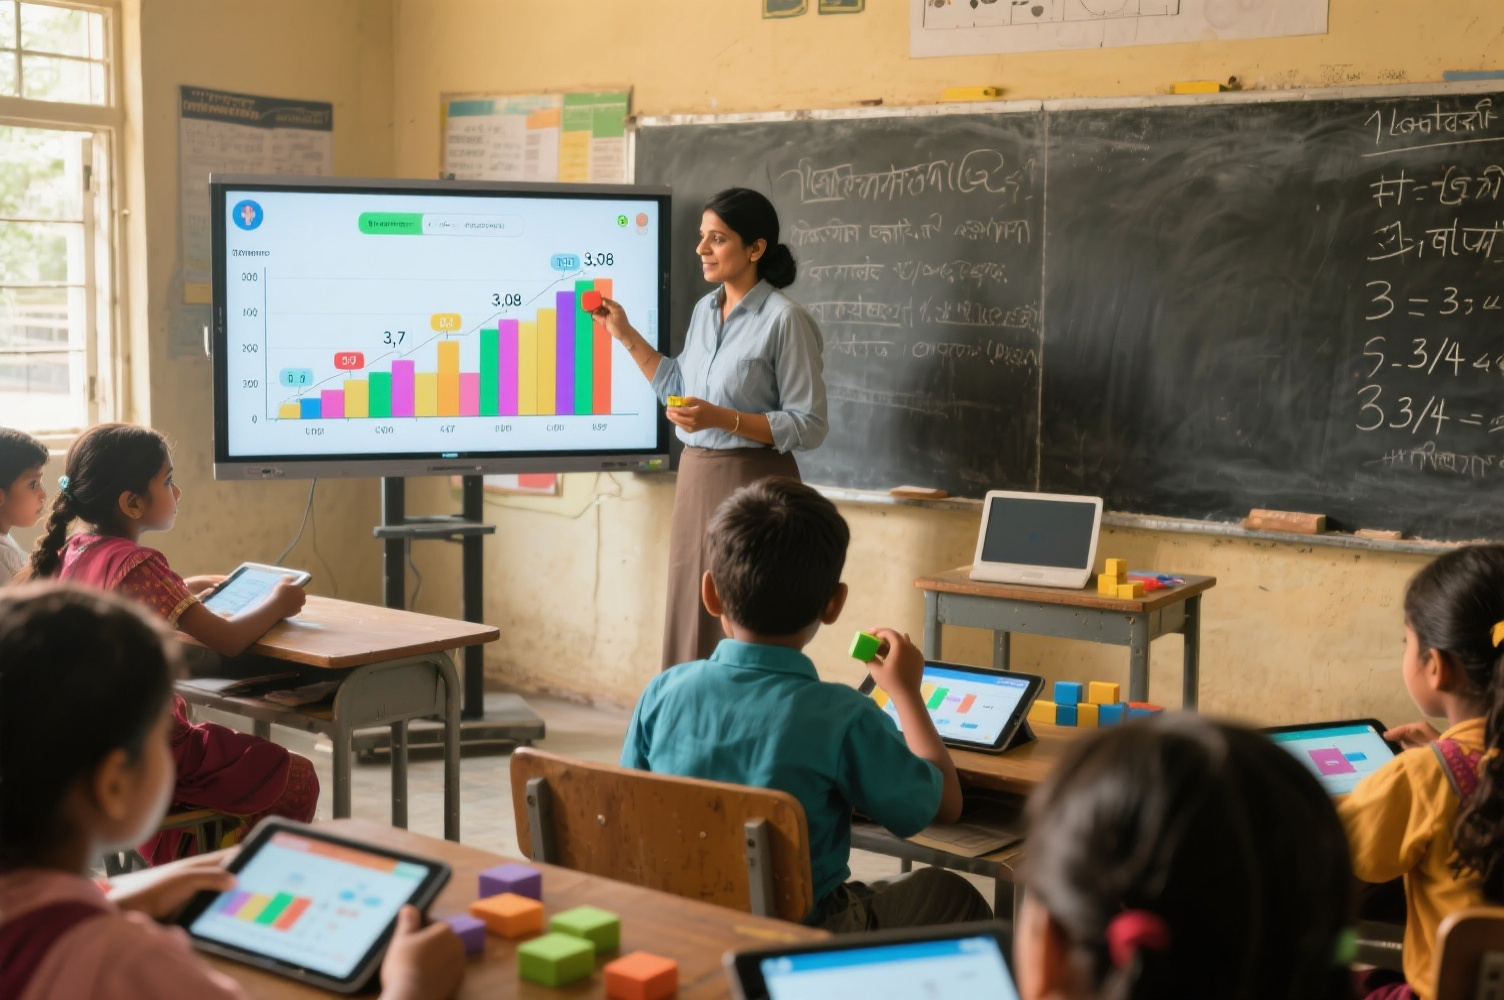
Technology in education has a great potential to improve the learning outcomes of students. However, the results of the Programme for International Student Assessment (PISA) study[1] show no appreciable improvement in student achievement in the countries that had invested heavily in digital technology for education. According to PISA findings, students (15-year olds) who use computers moderately at school tend to have somewhat better learning outcomes than students who use computers rarely. But students who use computers very frequently at school perform worse in most learning outcomes, even after accounting for social background and student demographics. What do these PISA findings indicate? What can explain these findings? How should technology be used in schools with the goal to improve learning outcomes?
Will replacing traditional blackboards with smart boards in classrooms be sufficient? Often, technology in use is more focused on the digitisation of textbooks. Showing good videos and animations on the learning content may have its own benefits. However, real learning may happen if a learner is learning-by-doing and the use of technology can aid that. Improvement in students’ learning outcomes with the use of digital technology in schools can be achieved if technology can enable the following:
- facilitate the development of deeper conceptual understanding
- promote the development of higher-order thinking skills apart
- reduce inequalities in learning levels.
In this way, technology has a great potential to enable learning if used appropriately and judiciously.
We have discussed Technology Enhanced Items (TEI) in our previous blog. In this article, let us explore more about technology-based interactives, how they can enable learning-by-doing, facilitate developing deeper conceptual understanding, and also promote higher-order thinking skills. The TEI’s are mostly assessment items used to measure students’ learning and to understand their thought processes. The technology-based interactives that we are discussing here in the context of an intelligent tutoring system (ITS) are mainly to enable learning and remediate misconceptions. These interactives may be effort-intensive to create. The content creator needs expertise in both pedagogy as well as technology. However, it is worth investing in developing interactives as they have the potential to increase students’ engagement, as well as facilitate deeper and real learning. Once these interactives are developed, they can be used at scale with large number of students. Personalised adaptive learning solutions like Mindspark (ITS) help students learn a concept at their own pace and through the instant feedback given. The power of ITS is unleashed better when its content is not restricted just to posing questions and sharing feedback through an evaluation of responses but if it also has interactives to engage a learner more deeply promoting learning-by-doing. Let us understand this with a few examples of interactives used in Mindspark to help students learn concepts in mathematics.
Examples of some interactives from Mindspark that aid learning
The interactives discussed in this article have been designed to achieve one or more of the following objectives of learning:
- facilitate conceptual understanding
- aid in overcoming misconceptions among learners
- promote higher-order thinking skills
- facilitate learning by applying best pedagogical practices like learning-by-doing, posing questions within the zone of proximal development
Interactives using virtual manipulatives:
Manipulatives are used to aid the development of conceptual understanding. Interactives can allow using virtual manipulatives to aid learning.

Figure 1: Interactive allowing a learner to compare two decimals with the help of a virtual manipulative
A learner is asked to compare the two decimal fractions and can take help of a virtual manipulative to aid reasoning. The interactive in Figure 1 allows a learner to represent both the decimal fractions. The green bars represent ones, the blue ones represent tenths, and the red ones, hundredths. A learner can compare the lengths of the bars representing the two decimal fractions to order them as 3.7 > 3.08.
This activity also helps in remediating a misconception that 3.08 is larger than 3.7 owing to the possible flawed reasoning that 3.08 has more digits after the decimal point than 3.7 and hence 3.08 is greater than 3.7. A learner can see that the length of the bar representing 3.7 is more than that of 3.08 and hence 3.7 > 3.08. Note, that here a learner herself represents the two numbers and then compares the two, thus promoting learning-by-doing. Hints or scaffolding and corrective feedback are given to help represent the two decimals without any human intervention making learning personalised. A learner is free to make mistakes and learn from them. The role of a facilitator is merely to nudge or probe a learner to explain reasoning applied to compare decimals as required if she wants to.
Some of the activities done in a class can also be done using technology. A carefully designed and easy-to-use interactive based on such an activity can help reduce cognitive load and help remain focused on learning. For example, in the interactive on the construction of a bar graph described in this video, a learner need not spend time drawing graphs and erasing if mistakes are committed. The time is better spent on learning the concept/skill associated with the activity.
Interactives on construction of a bar graph


Figure 2: Screenshot of an interactive allowing a learner to construct a bar graph
In such interactives, data to be represented as a bar graph is provided. Such interactives with variations in scaffoldings are meant to enable learning among learners of grades 4-6. The interactive helps to breakdown the task into intermediate steps as follows and enables learning-by-doing as evident in the video.
- Set the scale on vertical axis
- Choose labels and represent the data on the horizontal axis
- Construct bars of appropriate lengths to represent data for each value of the variable on the horizontal axis
Benefits
In constructing a bar graph, it is important for students to understand how setting an appropriate scale is the key to representing the given data meaningfully which in turn aids drawing of inferences. A learner in such interactives is free to reset the scale and construct a bar graph again at any instance while representing given data as bars of appropriate length as seen in the video. Most likely a learner will change the scale as she starts facing difficulty in choosing the appropriate length of a bar to represent the given data. As seen in the video, a scale can be changed even after representing the given data. The interactive automatically adjusts the lengths of bars as per the new scale. As seen in the video, after a user had represented data with the scale on vertical axis as 1 unit = 1000, he changed the scale to 1 unit = 5000 and the interactive converted representation to as follows.

A learner can see the same graph with the scale as 1 unit = 1000 enables a more nuanced, detailed interpretation compared to when the scale is 1 unit = 5000.
In this way, it makes it easier and faster to ‘experiment’, iterate and learn, and so has an edge for a learner over doing the same on a piece of paper. Also note that a learner is personally working on this interactive in a ‘safe space’ where she is free to make mistakes and learn from them.
An interactive aiding development of higher-order thinking skills:
In this interactive (meant for grades 4-7), a learner is expected to compose a given fraction as a sum of unit fractions in different ways. Watch this video to understand the ask from a learner and how it facilitates learning.

The interactive gives visual cues that 1/2 = 1/4 + 1/4 (as the length of one yellow bar representing 1/2 is the same as the total lengths of two orange bars where each orange bar represents 1/4).
The equation 1/2 < 3/4 here gives a cue to add more to 1/2 to make 3/4 and gives feedback if a learner has made 3/4 exactly or less/more than 3/4. A learner can compare the length of the tiles here to see what exactly fits the remaining green bar showing 3/4 to identify what more to add to 1/2 to make 3/4.
A learner associates ”measure” meaning of fractions here. Traditionally she is not exposed to and made to learn this meaning of fractions among many other meanings. In this pedagogically apt and well-designed interactive a learner also gets to compose a given fraction in multiple ways.

A learner may ‘discover’ that 1/2 can be represented in different ways as a sum of fractions and use them to identify different ways to represent 3/4. The interactive thus gives an opportunity to develop number sense and develop higher-order thinking skills.
Interactives can also be in the form of a guided activity to help discover a process and understand how the process/method works. For example, in one of the interactive activities in Mindspark, a learner is led to discover and understand the process of converting a fraction in mixed fraction form to its equivalent improper fraction form and why it works.
The use of interactives in GeoGebra in aiding discovery as well as verifying the known result/property is quite well known. One may argue such technology aided content is available only for higher grade Mathematics. However, we illustrated in the above examples how technology can aid the learning of concepts in lower grades as well.
These are only some examples of how technology can be used meaningfully and appropriately in a personalised learning environment and in a ‘safe space’ to learn from making mistakes:
- to aid the discovery of new knowledge by the learner herself
- to engage a learner with developing a deeper conceptual understanding
- help understand how an algorithm/process works
- to help overcome misconceptions
- to help promote the development of higher-order thinking skills
Let us embrace technology in classrooms in the right manner with the objective of improving student learning outcomes and exploring limitless possibilities!
_______________
*World Class – How to build a 21st century school system (page 260) by Andreas Schleicher (https://www.oecd.org/education/world-class-9789264300002-en.htm)


