No. of students who attempted this question- 23,468
Question Source: Ei ASSET Class: 8 Subject: Science
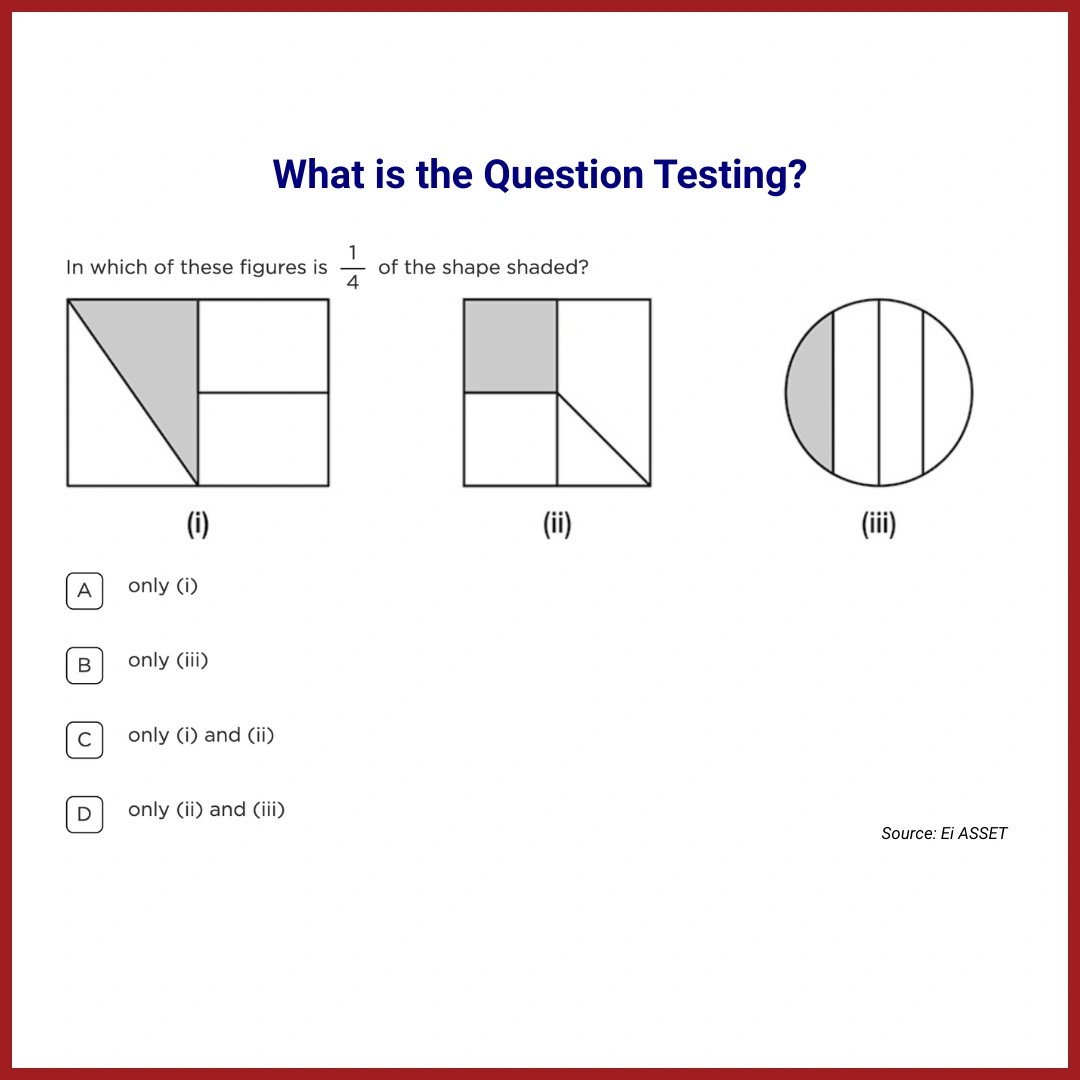
What is the Question Testing?
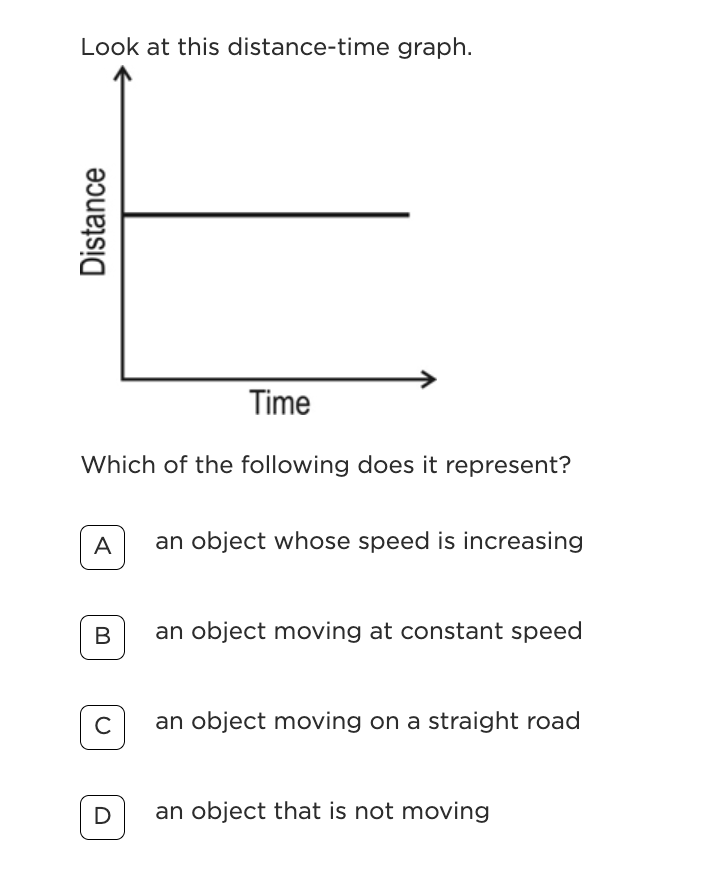
This question assesses students’ understanding of how to interpret a distance–time graph. Specifically, it tests whether students recognise that a horizontal line on such a graph represents a situation where distance does not change as time progresses. Students are expected to connect the graphical representation with the underlying physical meaning. A constant distance over time indicates that the object remains at the same position, and therefore is not moving.
The question also checks whether students can distinguish between different types of motion using graph features, rather than relying on surface-level interpretation of the graph.
What is the Most Common Wrong Answer and Possible Misconception?
Most Common Wrong Answer: Option B (an object moving at constant speed)
Percentage of Students Choosing Option B: 42.3%
A large proportion of students interpreted the straight horizontal line as representing constant speed. This suggests that they are associating any straight line with motion at a constant rate, without considering the slope of the graph.
These students are likely overlooking the fact that in a distance–time graph, speed is represented by the slope. A horizontal line has zero slope, which corresponds to zero speed. This indicates that the object is at rest. This reveals a deeper misconception about how graphs encode relationships between variables, particularly the meaning of slope in motion graphs.
This also elicits clear missing skill in the students.
Distractor Explanation :
Option A: an object whose speed is increasing Students choosing this option may be guessing or may have a vague idea that graphs represent change, without carefully analysing the nature of that change. Increasing speed would require a curve or a line with increasing slope, which is not present here.
Option B: an object moving at constant speed This is the most common error. Students correctly associate straight lines with constant speed but fail to interpret the slope. They do not recognise that a flat line corresponds to zero speed, not constant non-zero speed.
Option C: an object moving on a straight road This reflects a literal interpretation of the graph. Students may think the graph is a picture of the path taken by the object, rather than a representation of how distance changes over time.
Consequences of Children Not Developing This Concept
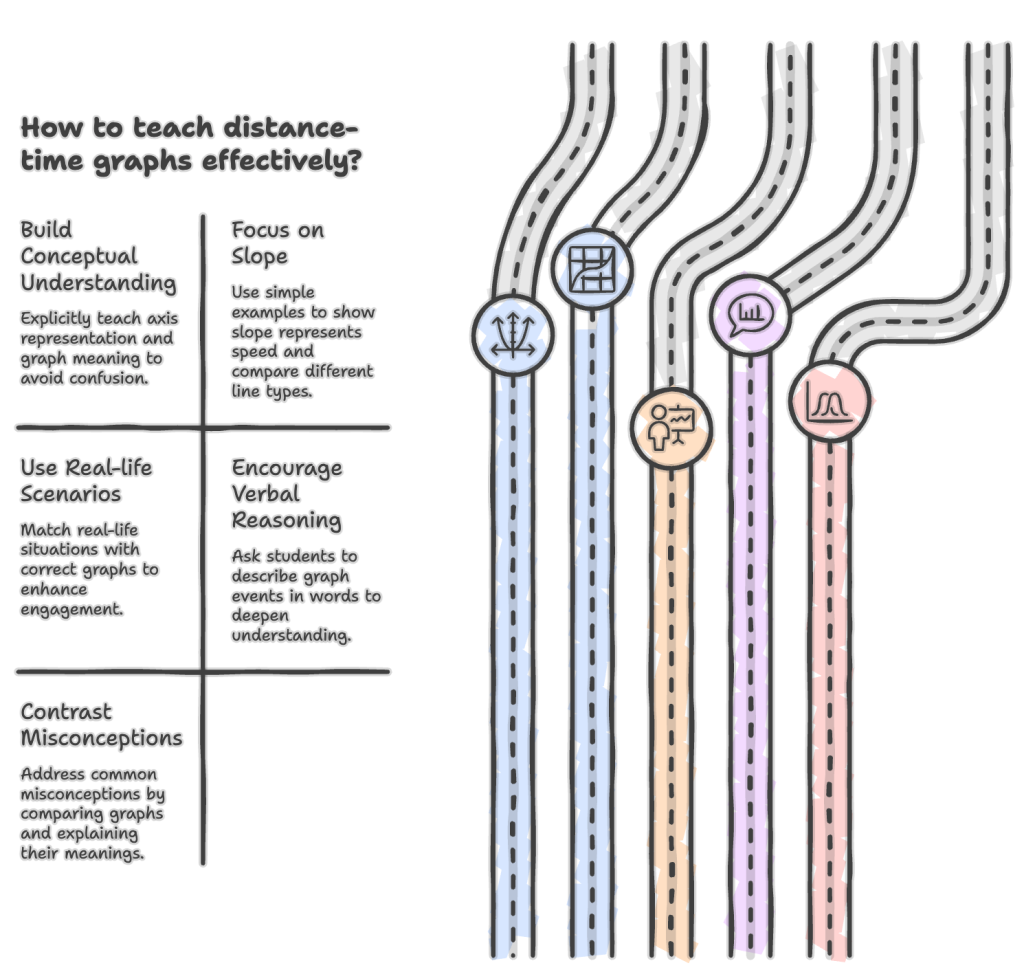
How Should I Remediate This in My Class?
Teacher Takeaway
Students often recognise patterns in graphs without understanding their meaning. In this case, many associate a straight line with constant speed, without interpreting the slope. Teaching should therefore focus on helping students connect graphical features with physical concepts, particularly the idea that no change in distance over time represents an object at rest.